

SIPBS Performance Analysis
Gas Consumption Performance Analysis
ES took regular gas consumption readings for the SIPBS building from both the BMS and the gas meter present within the SIPBS plant-room, however aquiring the data proved a challenge hence there were data missing for certain months. The actual gas meter readings in kWh are shown below in column 2 of table-1. Please note, all gas consumption figures are in kWh unless stated otherwise.
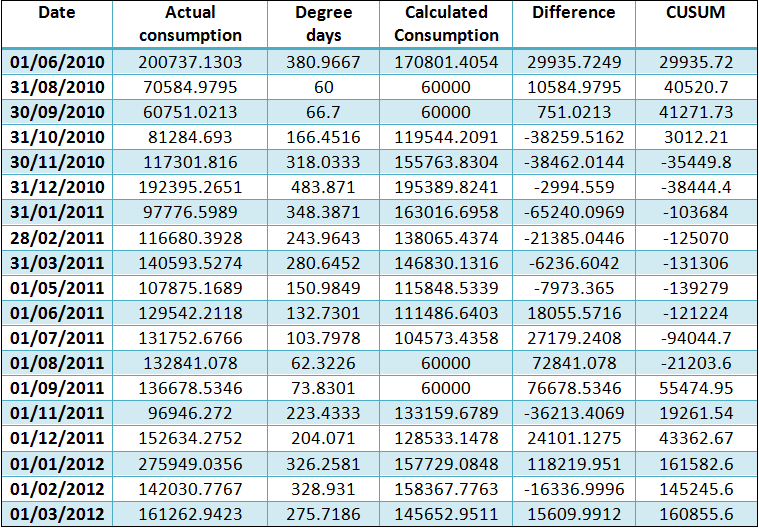
Table-1: Metered boiler gas usage and performance analysis
From this data a projected annual gas consumption was calculated. In order to achieve a realistic figure based on the collected data the team had to use a “degree day” method of projection that uses regression, as shown in figure-1 below. Degree days were acquired with help from the carbon trust degree days website
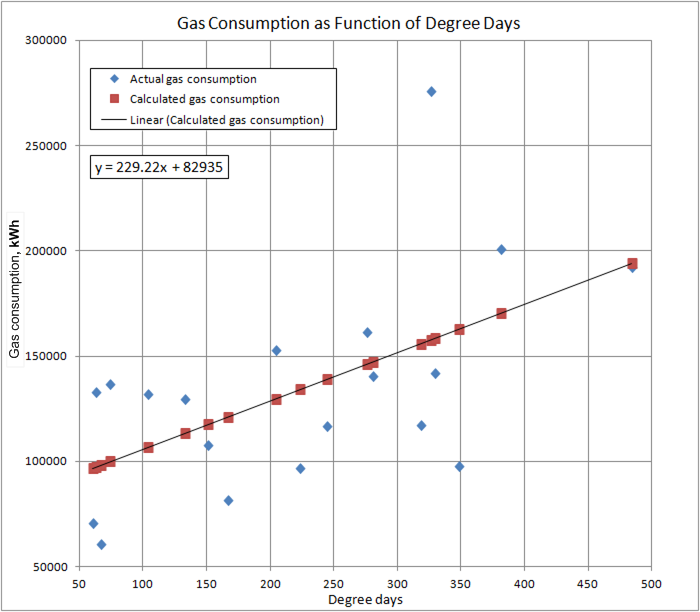
Figure-1: Gas consumption as a function of degree days regression
Moreover, from the data above (tabe-1 columns 1, 2 and 3) and from the data using the regresion function (tabe-1 column 4), a CUSUM (tabe-1 columns 5 and 6)control chart (based on carbon trust guidelines) was produced for the SIPBS building, for a period starting from when the building was first occupied. This graph is shown below.
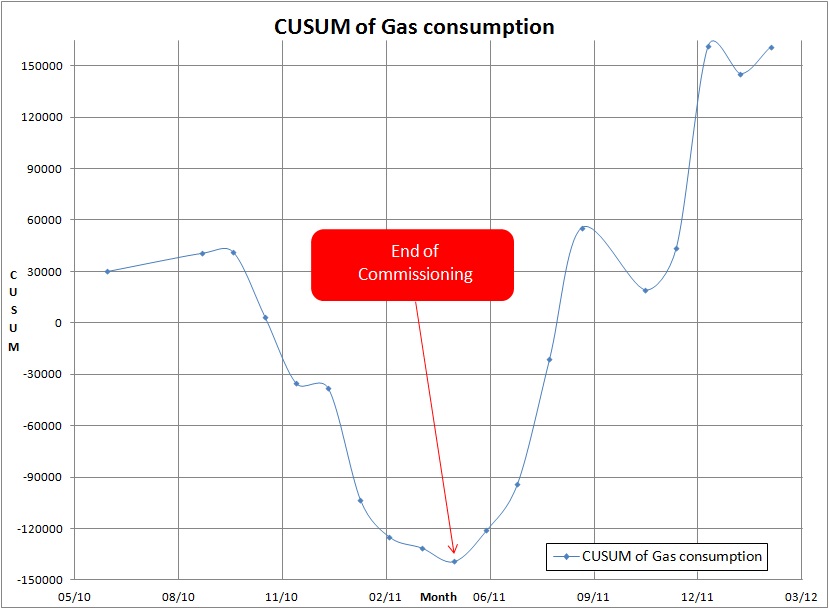
Figure-2: CUSUM analysis control chart
As can be seen from the graph(figure-2 above) the gas consumption decreases from November 2010 until May 2011, after which the gas consumption greatly increases until March 2012. From discussions with ES it was found that the lowest value recorded on this graph at May 2011 was the end of the commissioning process. This has shown the team that consultants and building services engineers were in operation until this point and as a result HVAC systems would have been operating at a high efficiency and all possible strategies of saving energy would have been deployed, such as closing of mechanical dampers in the teaching labs over night.
After the end of commissioning it is likely (discovered from both POE and discussions with ES) that the operation of the building reverted back to how it was operated around September and October 2010, when the gas consumption was increasing. This, coupled now with ES attempting to control the building independently and reacting to needs and complaints of the occupants, meant that the building was now being operated far less efficiently and consuming a greater volume of gas.
It has also became evident that it is likely that during the commissioning stages of the SIPBS building the efficiency and energy consumption was prioritised in expence of thermal comfort of the building users in an attempt to reduce energy consumption rather than trying to achieve a balance between efficient energy consumption, effective operational strategies and thermal comfort of the users.
Energy Benchmarking
After the annual gas consumption was calculated, both the electrical energy consumption (worked out from submeter reading) and the gas consumption were compared for benchmarking against CIBSE typical and good practise. These results are summarised in table-2 below along with the value for the EPC awarded to SIPBS. The units are in kWh/m2/annum.
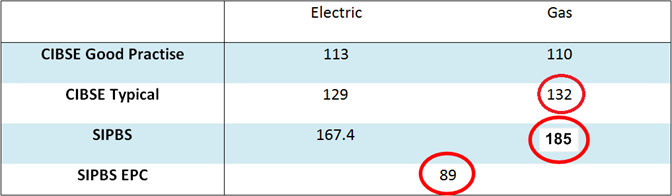
Table-2: SIPBS energy consumption against CIBSE benchmarks
Using the CIBSE guides the SIPBS building was compared to a higher education building with labs. From this benchmarking, it can be seen that the gas consumption of SIPBS is almost 1.4 times that of CIBSE typical practise. This, coupled with high figures of electrical consumption, show a higher overall energy use for comfort above that of the EPC belonging to SIPBS.
This clearly demonstrates the under performance of the SIPBS building with respect to both CIBSE guides and its own standard set in the EPC awarded for the building, which result in greater energy consumptions and therefore becoming more expensive to operate the building.
Finally, from the analysis of the results, it can be concluded that the building plant operation and control strategy is in need of further commissioning and control fine tuning. It is also believed that six monthly POE and seasonal commissioning (in the years immediatley following handover) would have helped to keep energy consumption to levels not far from what it was at hand over.